Culling data based on coastlines in GMT
This is a problem that took me way too long to figure out, but it is a simple one line command. The problem arose as I was taking a finite fault solution for the Kaikoura earthquake from a different author and forward modeling the surface displacements onto a set grid of points (in my case, either 10, 20 or 40 km). From there, I wanted to invert for a possible slip model based on this new grid of 'synthetic' GPS stations, therefore, I had to exclude any stations/grid points over water. The solution for this is the gmtselect command, and its used as follows:
Since my data was in a separate file (with columns lon, lat, east, north, up), I first start with the awk command within my bash script
awk '{print $1, $2, $3, $4, $5}' file.txt
I then add on the gmtselect command
awk '{print $1, $2, $3, $4, $5}' file.txt | gmtselect -R -Di -Ns/k/s/k/s > subset.txt
See, easy. The culled solutions are now in the file 'subset.txt' with the same column order that I used for awk. The -R flag is the same as any other GMT script (for region of interest), but the other two flags are very important. First, the -D flag specifies the coastal resolution. I actually tried greater resolutions (i.e. -Df or -Dh), but I got some odd behavior as some of the points at certain latitudes 'leaked' through the land. Obviously some sort of bug, but it goes away for the lower resolution coastlines and -Di is sufficient for my purposes. The -N flag is where all the power is, and one can obtain any clipping behavior they so desire. I chose the more verbose option, but there are two possibilities:
-Nwet/dry
-Nocean/land/lake/island/pond
where you fill in 's' to skip that feature and 'k' to keep that feature.
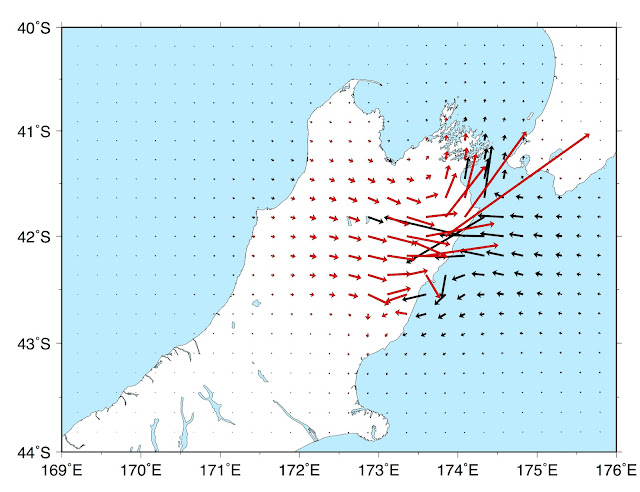
Here is the final figure, red vectors are on land, black offshore. Notice the one vector that is on land, but in a lake, so its colored black.
Since my data was in a separate file (with columns lon, lat, east, north, up), I first start with the awk command within my bash script
awk '{print $1, $2, $3, $4, $5}' file.txt
I then add on the gmtselect command
awk '{print $1, $2, $3, $4, $5}' file.txt | gmtselect -R -Di -Ns/k/s/k/s > subset.txt
See, easy. The culled solutions are now in the file 'subset.txt' with the same column order that I used for awk. The -R flag is the same as any other GMT script (for region of interest), but the other two flags are very important. First, the -D flag specifies the coastal resolution. I actually tried greater resolutions (i.e. -Df or -Dh), but I got some odd behavior as some of the points at certain latitudes 'leaked' through the land. Obviously some sort of bug, but it goes away for the lower resolution coastlines and -Di is sufficient for my purposes. The -N flag is where all the power is, and one can obtain any clipping behavior they so desire. I chose the more verbose option, but there are two possibilities:
-Nwet/dry
-Nocean/land/lake/island/pond
where you fill in 's' to skip that feature and 'k' to keep that feature.
Here is the final figure, red vectors are on land, black offshore. Notice the one vector that is on land, but in a lake, so its colored black.


Comments
Post a Comment